
Toronto’s GHG Targets
The City of Toronto continues to demonstrate leadership in mitigating the effects of climate change through the implementation of the climate action strategy, TransformTO. This ambitious strategy lays out the city’s long term low-carbon goals and plans for local greenhouse gas (GHG) emission reduction. The plan was approved by City Council in July 2017, with a stronger and accelerated emissions reduction target set in October 2019. Toronto’s GHG emissions reductions targets use 1990 GHG levels as the baseline for benchmarking.
Toronto’s GHG emissions reductions targets are as follows:
- 30% GHG reduction by 2020
- 65% GHG reduction by 2030
- Net zero by 2050, or sooner (previously 80% reduction by 2050 but revised on October 2, 2019 due to City Council’s climate emergency declaration)
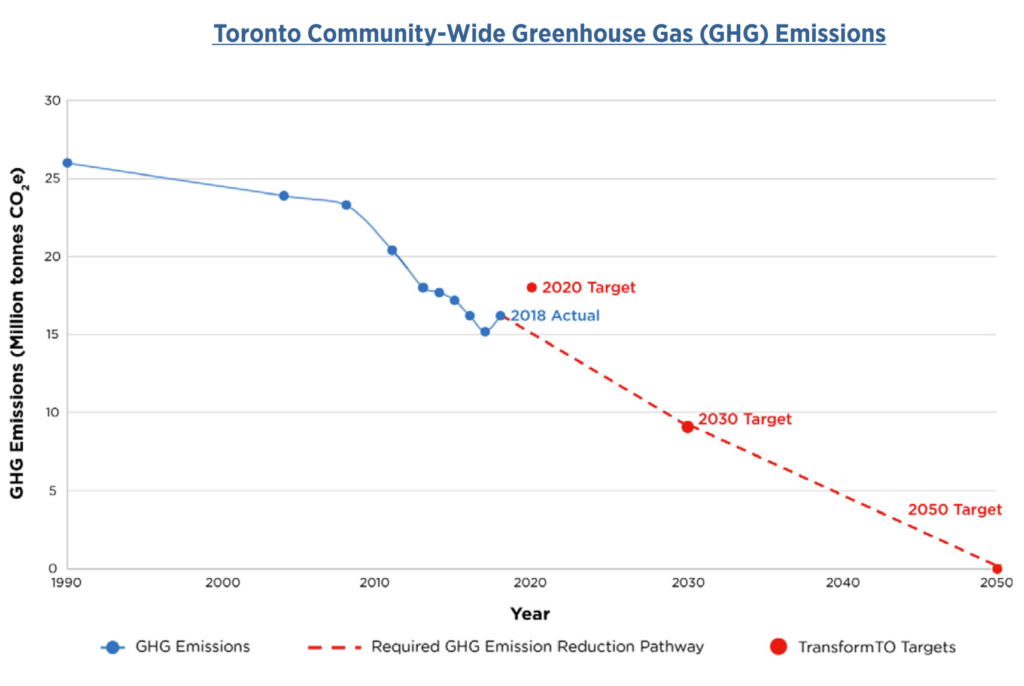
Figure 1: Toronto Community-Wide GHG Emissions. 2018 Greenhouse Gas Emissions Inventory, page 2. City of Toronto
The goals set for homes, buildings and energy are as follows:
- All new buildings will be built to produce “near zero” (not defined) GHG by 2030
- All existing buildings will have to be retrofitted to meet net zero emissions by 2050
- 100% of energy will come from renewable or low-carbon sources by 2050
GHG Emissions to Date
Currently, building operations make up the majority of Toronto’s GHG emissions. Toronto’s 2018 GHG emissions inventory found that 55% of GHG emissions in Toronto come from buildings. The city has also been disclosing its GHG emissions inventory to the Carbon Disclosure Project (CDP), which includes scope 1, 2, and 3 emissions (for a definition on scope emissions for cities, see Table 2, page 13 of the Global Protocol for Community-Scale Greenhouse Gas Emission Inventories by Greenhouse Gas Protocol). The following figure shows annual GHG emissions in Toronto by sector, from 1990 to 2018.
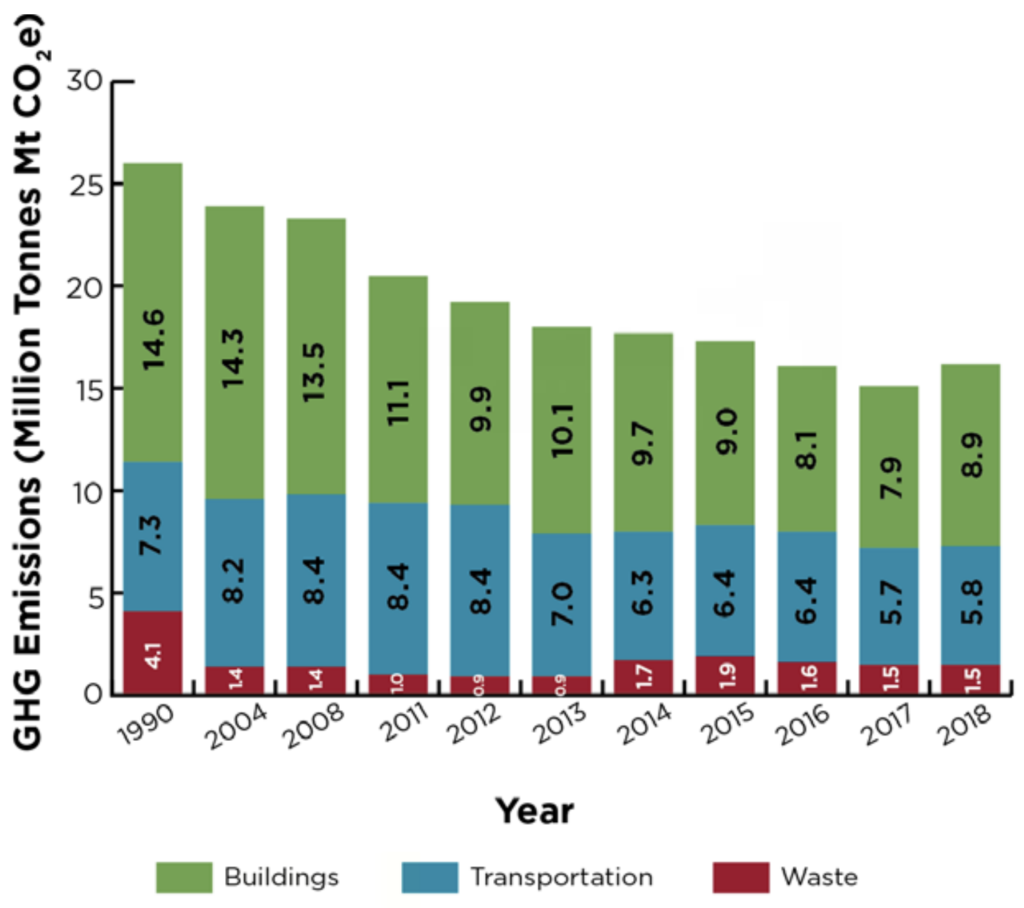
Figure 2: 1990-2018 GHG emissions in Toronto by sector. 2018 Greenhouse Gas Emissions Inventory, page 3. City of Toronto
Figure 3 shows the breakdown of building GHG emissions by building types. These operational GHG emissions come primarily from burning natural gas to heat indoor space and water. The embodied carbon emissions of buildings, also known as life cycle emissions outside of operational, are not currently calculated or disclosed by the City (they would be included as a scope 3 emissions).
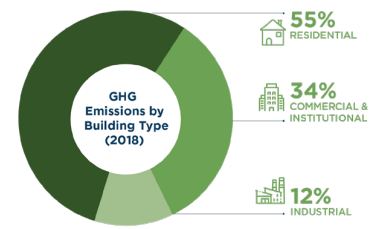
Figure 3: 2018 GHG Emissions by Building Type in Toronto. 2018 Greenhouse Gas Emissions Inventory, page 7. City of Toronto
Understanding Building Stock and Urban Trends in Toronto
Toronto’s existing building stock energy demand and population trends highlight the importance of building retrofits for reducing GHG emissions. This is especially true for residential buildings, which make up over half of building GHG emissions.
Prior to 2001, condominium units comprised a small share of Toronto’s building stock. However, according to 2016 census data, there has been a rapid emergence of condominium units representing the majority of housing stock in Toronto. Between 2011 and 2016, 82% of all housing units completed in Toronto were condos. Similarly, in those 5 years, Toronto’s population has had the highest growth out of all Greater Toronto and Hamilton Area (GTHA) municipalities. This has caused pressure on the demand for housing, specifically mid/high rise apartment buildings which have seen almost an 8% increase in occupancy since 1996.
As these buildings begin to age, retrofit strategies need to be considered. While it is difficult to predict the exact life expectancy of any type of building due to many future factors such as rezoning, population growth, and policy changes, all buildings generally follow similar life cycle stages (shown in Figure 4). After initial construction, routine maintenance and capital renewals are required. Around 20 years marks the start of meaningful capital renewals that can impact the GHG emissions of the building including re-roofing and replacement of heating systems. Between approximately 30-49 years, shorter life assets willbe due for a second round of renewal and major adaptations and upgrades will take place. These are often exterior cladding renewal and interior renovations.
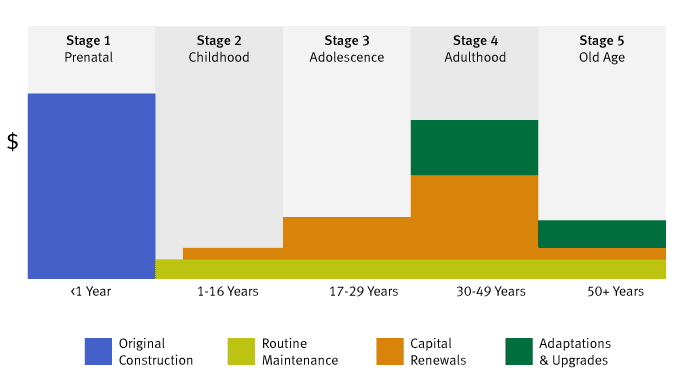
Figure 4: Life Cycle Stages of a Building. How Long Do Buildings Last?. RDH
Building age isn’t the only factor that stresses the importance of wide-scale retrofits. Climate change is causing more extreme weather patterns, such as heat waves and heavy precipitation. The vast majority of residents living in apartment buildings have no air conditioning which is becoming a major concern when more deaths are being linked to heat waves. Read more about Toronto’s resilience strategy to combat climate change.
Toronto’s Net Zero Existing Buildings Strategy
As Toronto’s buildings and climate approach a critical time for upgrades, the city has put forth actions for reducing GHG emissions of existing buildings. On July 14, 2021 City Council approved new TransformTO strategies and plans, including the Net Zero Existing Buildings Strategy. The intent of this strategy is to help enable and expedite the initiation of retrofits by building owners, and aims to maximize co-benefits while minimizing potential harm to tenants and owners. The performance measures and targets will initially be voluntary, and will transition to mandatory requirements by 2025 for most buildings.
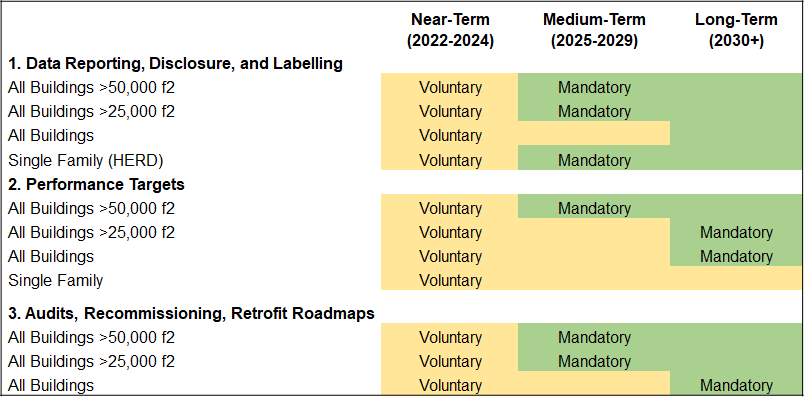
Figure 5: Potential Implementation Timeline. Net Zero Existing Buildings Strategy: BBP Webinar. City of Toronto
The Net Zero Existing Buildings Strategy includes the following nine key policy action recommendations the City can implement:
- Require annual reporting and public disclosure for emissions performance from all building owners
- Establish emissions performance targets
- Audits and tune-ups for energy and emissions
- Provide support to aid in the reduction of cost, complexity, and time related to retrofits
- Improve retrofit financing
- Simplify permitting and approval for deep retrofits
- Awareness and capacity building for homeowners to undertake emissions reduction measures
- Support for workforce training and development
- Collaboration with other orders of government
The strategy includes recommendations for the City of Toronto for short, medium and long term sector-specific (multi-unit residential building, single family home, commercial, institutional) actions for implementation. These recommendations primarily focus on reducing operational emissions as the majority of existing building emissions result from natural gas and electricity usage (on site and upstream). The strategy also acknowledges the contributions of embodied and fugitive refrigerant emissions, although reduction targets are not yet set for these.
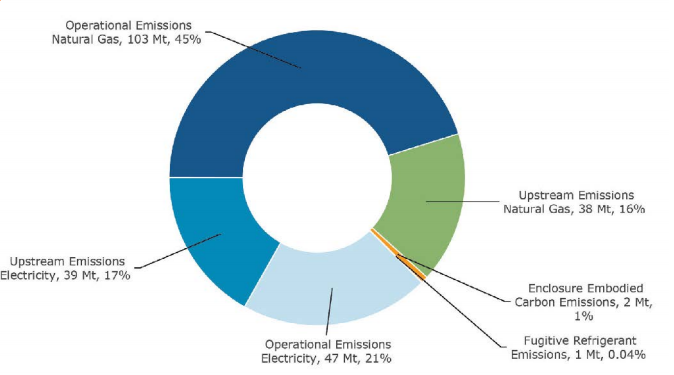
Figure 6: Operational, Upstream, Embodied and Fugitive Emissions in Toronto’s Building Sector Accumulated over 30 years. The City of Toronto’s Net Zero Existing Buildings Strategy, page 61. City of Toronto
In the next 30 years, the Net Zero Existing Buildings Strategy is estimated to increase local building retrofit economic activity by 87%. The costs associated with building retrofits represents a considerable investment for building owners. Currently, the following City financial incentive and guidance programs can be leveraged by building and home owners to support the the transition to a net zero building sector:
- Green Will Initiative
- Energy Retrofit Loans (ERL)
- Sustainable Towers Engaging People (STEP)
- Navigation and Support Services
- High-Rise Retrofit Improvement Support Program (Hi-RIS)
- Home Energy Loan Program (HELP)
- BetterHomesTO
Future Action
Shifts in government regulation have already begun. The Government of Ontario put into force the Energy and Water Reporting and Benchmarking (EWRB) program, which sets a strong foundation for achieving TransformTO’s emissions reduction target net zero by 2050. This provincial-wide benchmarking initiative requires mandatory reporting of annual energy and water use for the following:
- Buildings 100,000 square feet and larger (as of July 1, 2019)
- Buildings 50,000 square feet and larger (as of July 1, 2023)
This initiative is designed to help building owners understand and reduce their energy and water consumption. What gets measured gets managed – when building owners track and compare consumption against similar buildings, energy and water efficiency measures can be found and implemented.
With the GHG reduction targets set out by TransformTO, and recommendations set out by the Net Zero Existing Buildings Strategy to achieve the targets, the next step is a whole market shift. The existing building market must now undergo significant and rapid transformation, which requires investment and collaborative action.
A city-wide study of packages of measures for building-level retrofits concluded that while it is possible to reduce existing building emissions by 80% by 2050 through deep emissions retrofits, additional measure such as renewable energy installation and grid-scale decarbonization (which would also have benefits to grid resilience) will be necessary to meet the City’s net-zero goal by 2050. This means that considerable and harmonized efforts will be required on the part of all parties (building owners, utilities, all levels of government, etc) for a sustainable, low carbon future.
Mantle Developments can help reduce your exposure to climate risk.
Contact us for help understanding the risks and opportunities that climate change poses to your business and how to manage them. We can help your team establish climate adaptation and emission mitigation plans to keep you ahead of the climate curve.